About Me
Frida Putriassa, fresh graduate majoring in Information Systems, specializing in the domains of data collecting, analysis, visualization, and modeling. Proficient in Python, R, SQL, and Advanced Excel. Dedicated to facilitating data-driven decision-making processes. A resourceful problem solver with a collaborative spirit and actively pursuing opportunities in data analysis or data science.
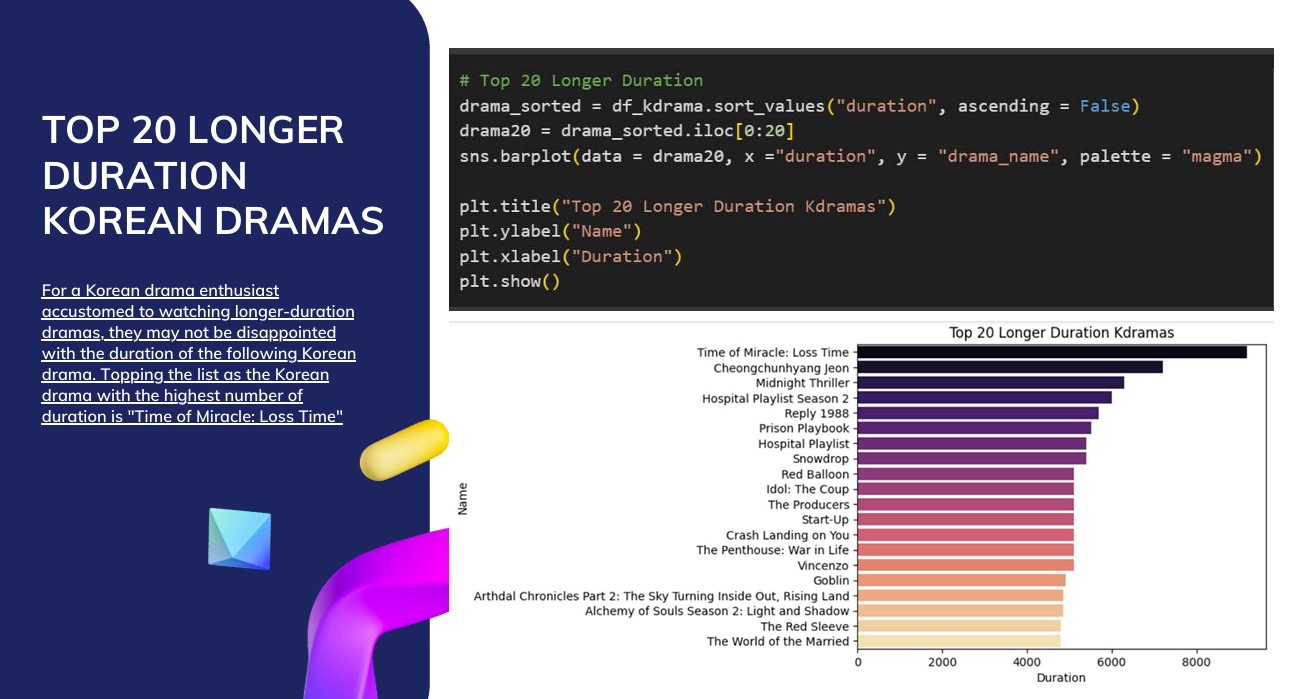
Data Analytics
Extracting insights from complex datasets to inform strategic decisions, using tools like SQL and Python for efficient data processing and analysis.
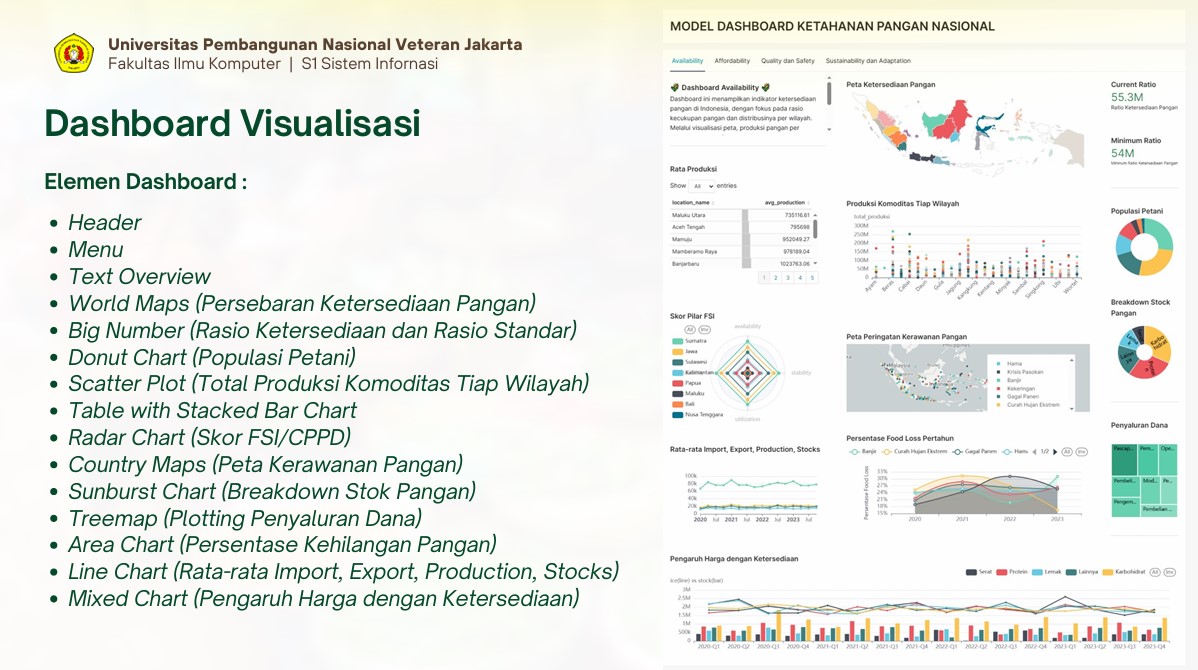
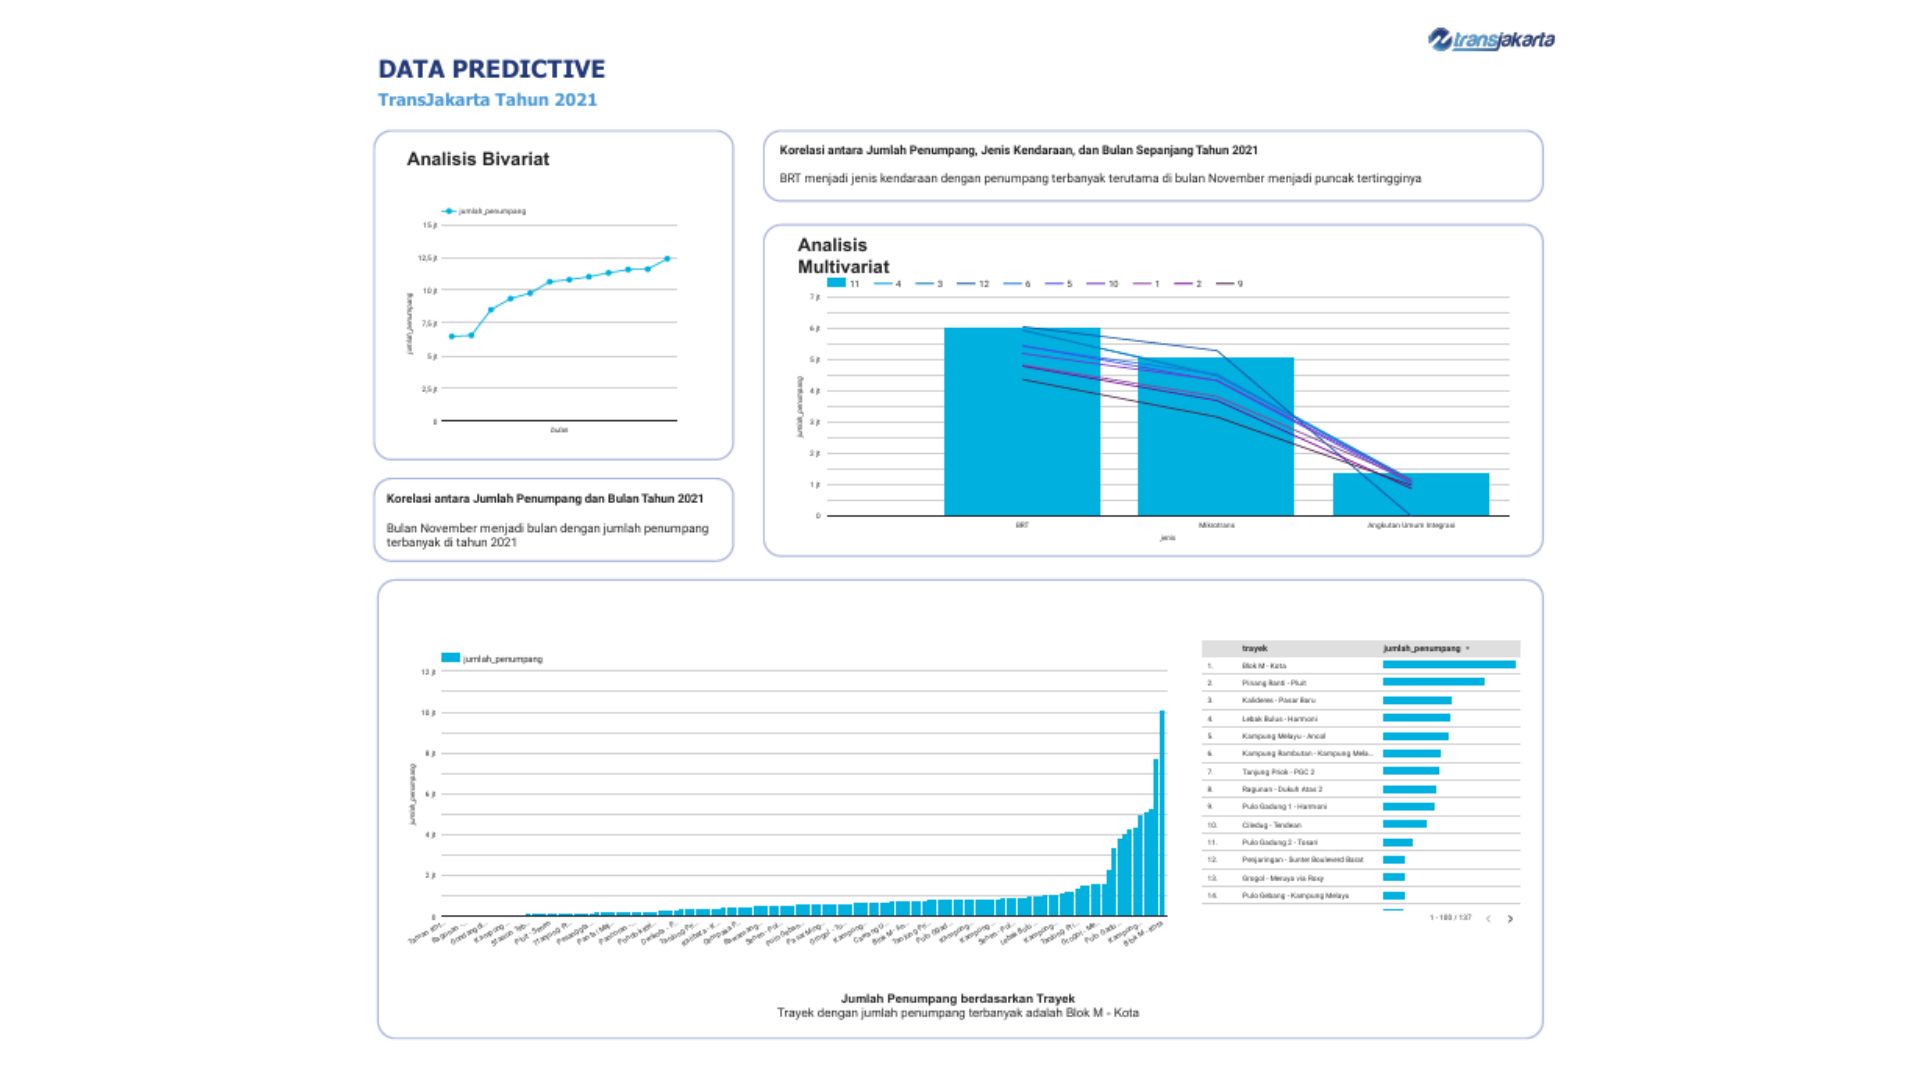
Data Visualization
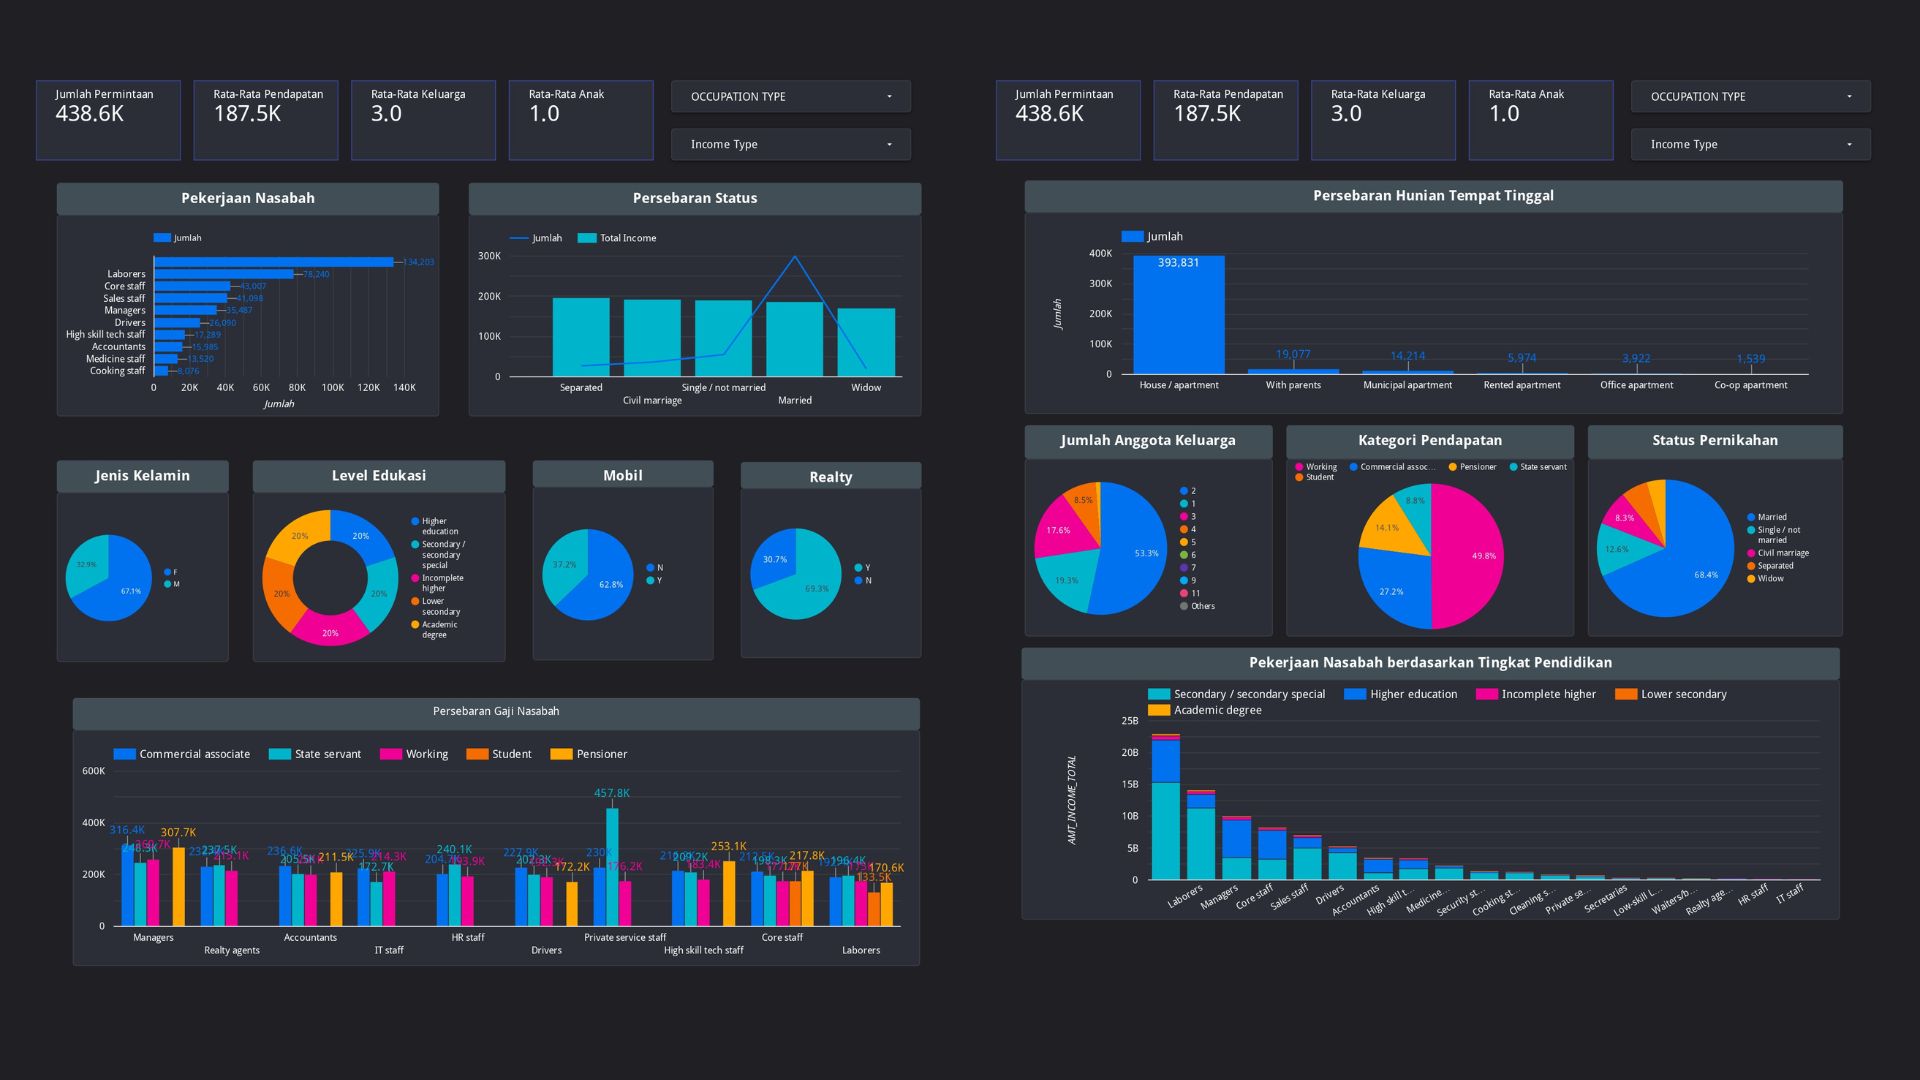
Creating compelling visual representations of data with Tableau, Power BI, and Looker Studio to communicate findings effectively.
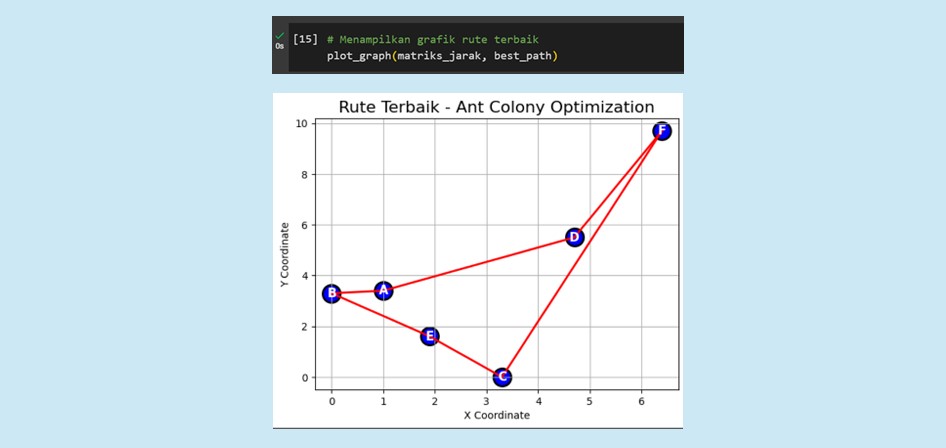
Machine Learning
Building and deploying ML models using Scikit-Learn and PyTorch for predictive analytics and recommendation systems.
Education
Universitas Pembangunan Nasional "Veteran" Jakarta
Aug 2021 - July 2025
Bachelor Degree in Information System, Minor in Data Science
GPA: 3.92 / 4.00
Relevant Coursework: Data Science, Data Warehouse and Data Management, Big Data, Data Management,
Business Intelligence, Artificial Intelligence, Financial Technology.
Work Experience
President - KSM Cyber Security UPNVJ
- Led a team of 25 in organizing and executing diverse events throughout the academic year
- Stayed at the forefront of emerging cybersecurity trends, integrating cutting-edge tools and methodologies to enhance organization analytical capabilities and effectiveness.
- Achieved a significant 57% increase in attendance and participation across club activities.
- Presented data-driven insights to guide strategic initiatives and achieve organizational goals.
Data Analyst Intern - PT Bank Rakyat Indonesia (Persero) Tbk.
- Spearheaded the management and analysis of 1M+ rows for each sheet at Master Data using Excel.
- Processed large multi-source transaction datasets and determined winner ranking for data reporting Qlola reward enhancement project using Excel and Python.
- Built and fine-tuned predictive models for cash flow projection using Python (PyTorch, Scikit-Learn) on Google Cloud Platform (GCP), achieving MAPE < 5% (avg. 1%).
- Created minutes of meetings for corporate clients meeting and internal team meetings to ensure documentation and follow-up on action plan and decisions.
Data Analytics Intern - PT Bank Negara Indonesia (Persero) Tbk.
- Developed Sales and Product Performance Dashboard Report using Looker Studio for the final project, help team keeps track on KPIs and YTD Target, providing insights about 400+ corporate clients in our segment.
- Processed 500,000+ row data using Excel, conducted data analysis using spreadsheets, and utilized Python for data cleansing.
- Participated in sharing sessions to enhance understanding of international banking and trade, contributing insights to team discussions and improving data comprehension.
- Created minutes of meetings for corporate clients meeting and internal team meetings to ensure documentation and follow-up on action plan and decisions.
Staff of People Development Division - KSM Cyber Security UPNVJ
- Handled open recruitment such as managing applicants data and selecting suitable candidates, achieved 40% increase in member growth.
- Presented KSM Cyber Security introduction and spearheaded the open recruitment promotion to 450 audience at CGT (Computer Get Together) FIK UPNVJ.
- Implemented 3 comprehensive training programs related to cybersecurity for 168 members and managed the data analytics component for providing counsel on performance evaluations and member development.
Head of Group Project Volunteer - NOVO Club by Paragon
- Collaborated with 5-member team in an environmental conservation project by conducting waste sorting awareness for 16 children at RA Al Falah, promoting eco-friendly habits.
- Elevated project KPIs by 35% through streamlined report management, ensuring timely and accurate documentation of project achievements, advancing leadership skills by 30% through a successful bootcamp.
Volunteer of Economy and Tourism Division - Bakti Negeri #4 Sisi Indonesia Chapter Pulau Panjang
- Delivered a presentation at UMKM Talk on branding and digital marketing, driving a 26.67% engagement rate from the audience through Q&A sessions and interactive discussions.
- Collected and Managed halal certification data using Microsoft Excel, certifying 7 of local businesses.
- Lead volunteers for planting 75 mangroves, contributing to environmental sustainability.